Call Us Back
Kindly fill the above infomation and one of our executive will call you in 48 Hr.

Business Problem – Identifying growth drivers in existing markets and products markets and recommending actions to replicate them in newer markets and product segments
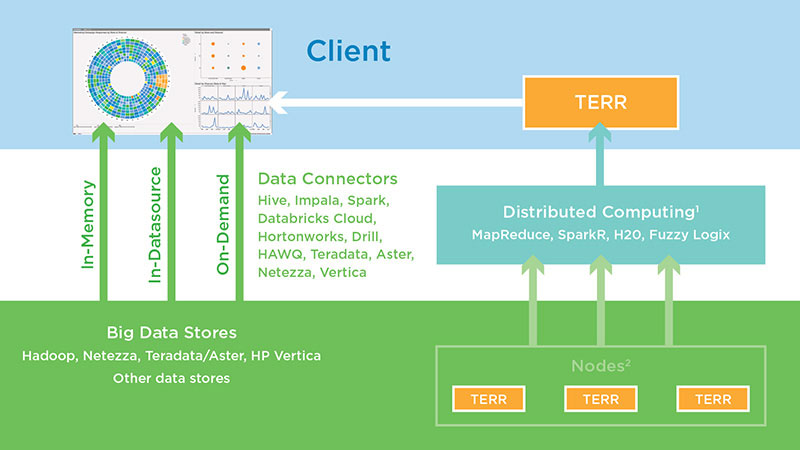
Setting up Big Data infrastructure to handle large Retail data.
Merging disparate data sources, applying business rule and feature extraction to create analytical data set to be used for hypothesis testing and modelling.
Univariate and multivariate analysis to understand different variables and their relationships.
Exploration and hypothesis testing to understand business trends and provide guidance toward the modelling approach.
Applying different regression techniques to determine the drivers of growth.
Decision Tree analysis to understand the path and actionability towards achieving growth at store clusters.
Provide insights based on exploration and driver analysis.
Recommend guidelines to achieve incremental growth at store clusters.
Some of the key hypothesis are listed below:


Decompose the overall sustainable growth at store clusters into their primary components to identify their contribution:
Multiple statistical techniques will be used to determine the important drivers that are contributing to the growth of each of the components.
Recommend actionable steps for every store cluster, by identifying which of the important drivers extracted above have to be addressed for that cluster.


Total price: 50*1.2 + 40*0.9 = 96
Total price: 60*1.3 + 50*1 + 45*1.4 = 191
Total units sold (New SKU) * Unit price of new SKU
45*1.4 = 63Growth %: 63/96 = 65.6%
[Total units sold (C.M.) - Total existing units sold (P.M.)] * (Total sales [P.M.] / Total units sold [P.M.]) for existing SKUs
(110-90) * (96/90) = 21.33Growth %: 21.33/96 = 22.2%
ΣSKU (Total units sold (C.M.) * (Price C.M. – Price P.M.) for existing SKUs
60(1.3-1.2) + 50(1-0.9) = 6 + 5 = 11Growth %: 11/96 = 11.4%
For ease of calculation, inflation/price change growth to be considered in Volume growth.ΣSKU (Total units sold (C.M.) *Price (P.M)) - [Total units sold (C.M.)* Total sales (P.M.) / Total units sold (P.M.)] for existing SKUs
60*1.2 + 50*0.9 – 110*96/90 = 117 – 117.33 = -0.33Growth %: (-0.33)/96 = (-0.34)%
Univariate non-graphical: to help identify any outliers and better understand the distribution of the sample by primarily utilizing descriptive statistics.
Visualization of the descriptive statistics from the non-graphical techniques, including but not limited to:
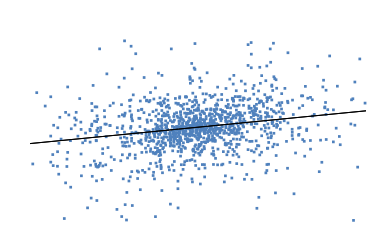
To understand the relationship between two or more of the variables contained in the databases through statistical techniques, including but not limited to: